Mapping Consulting
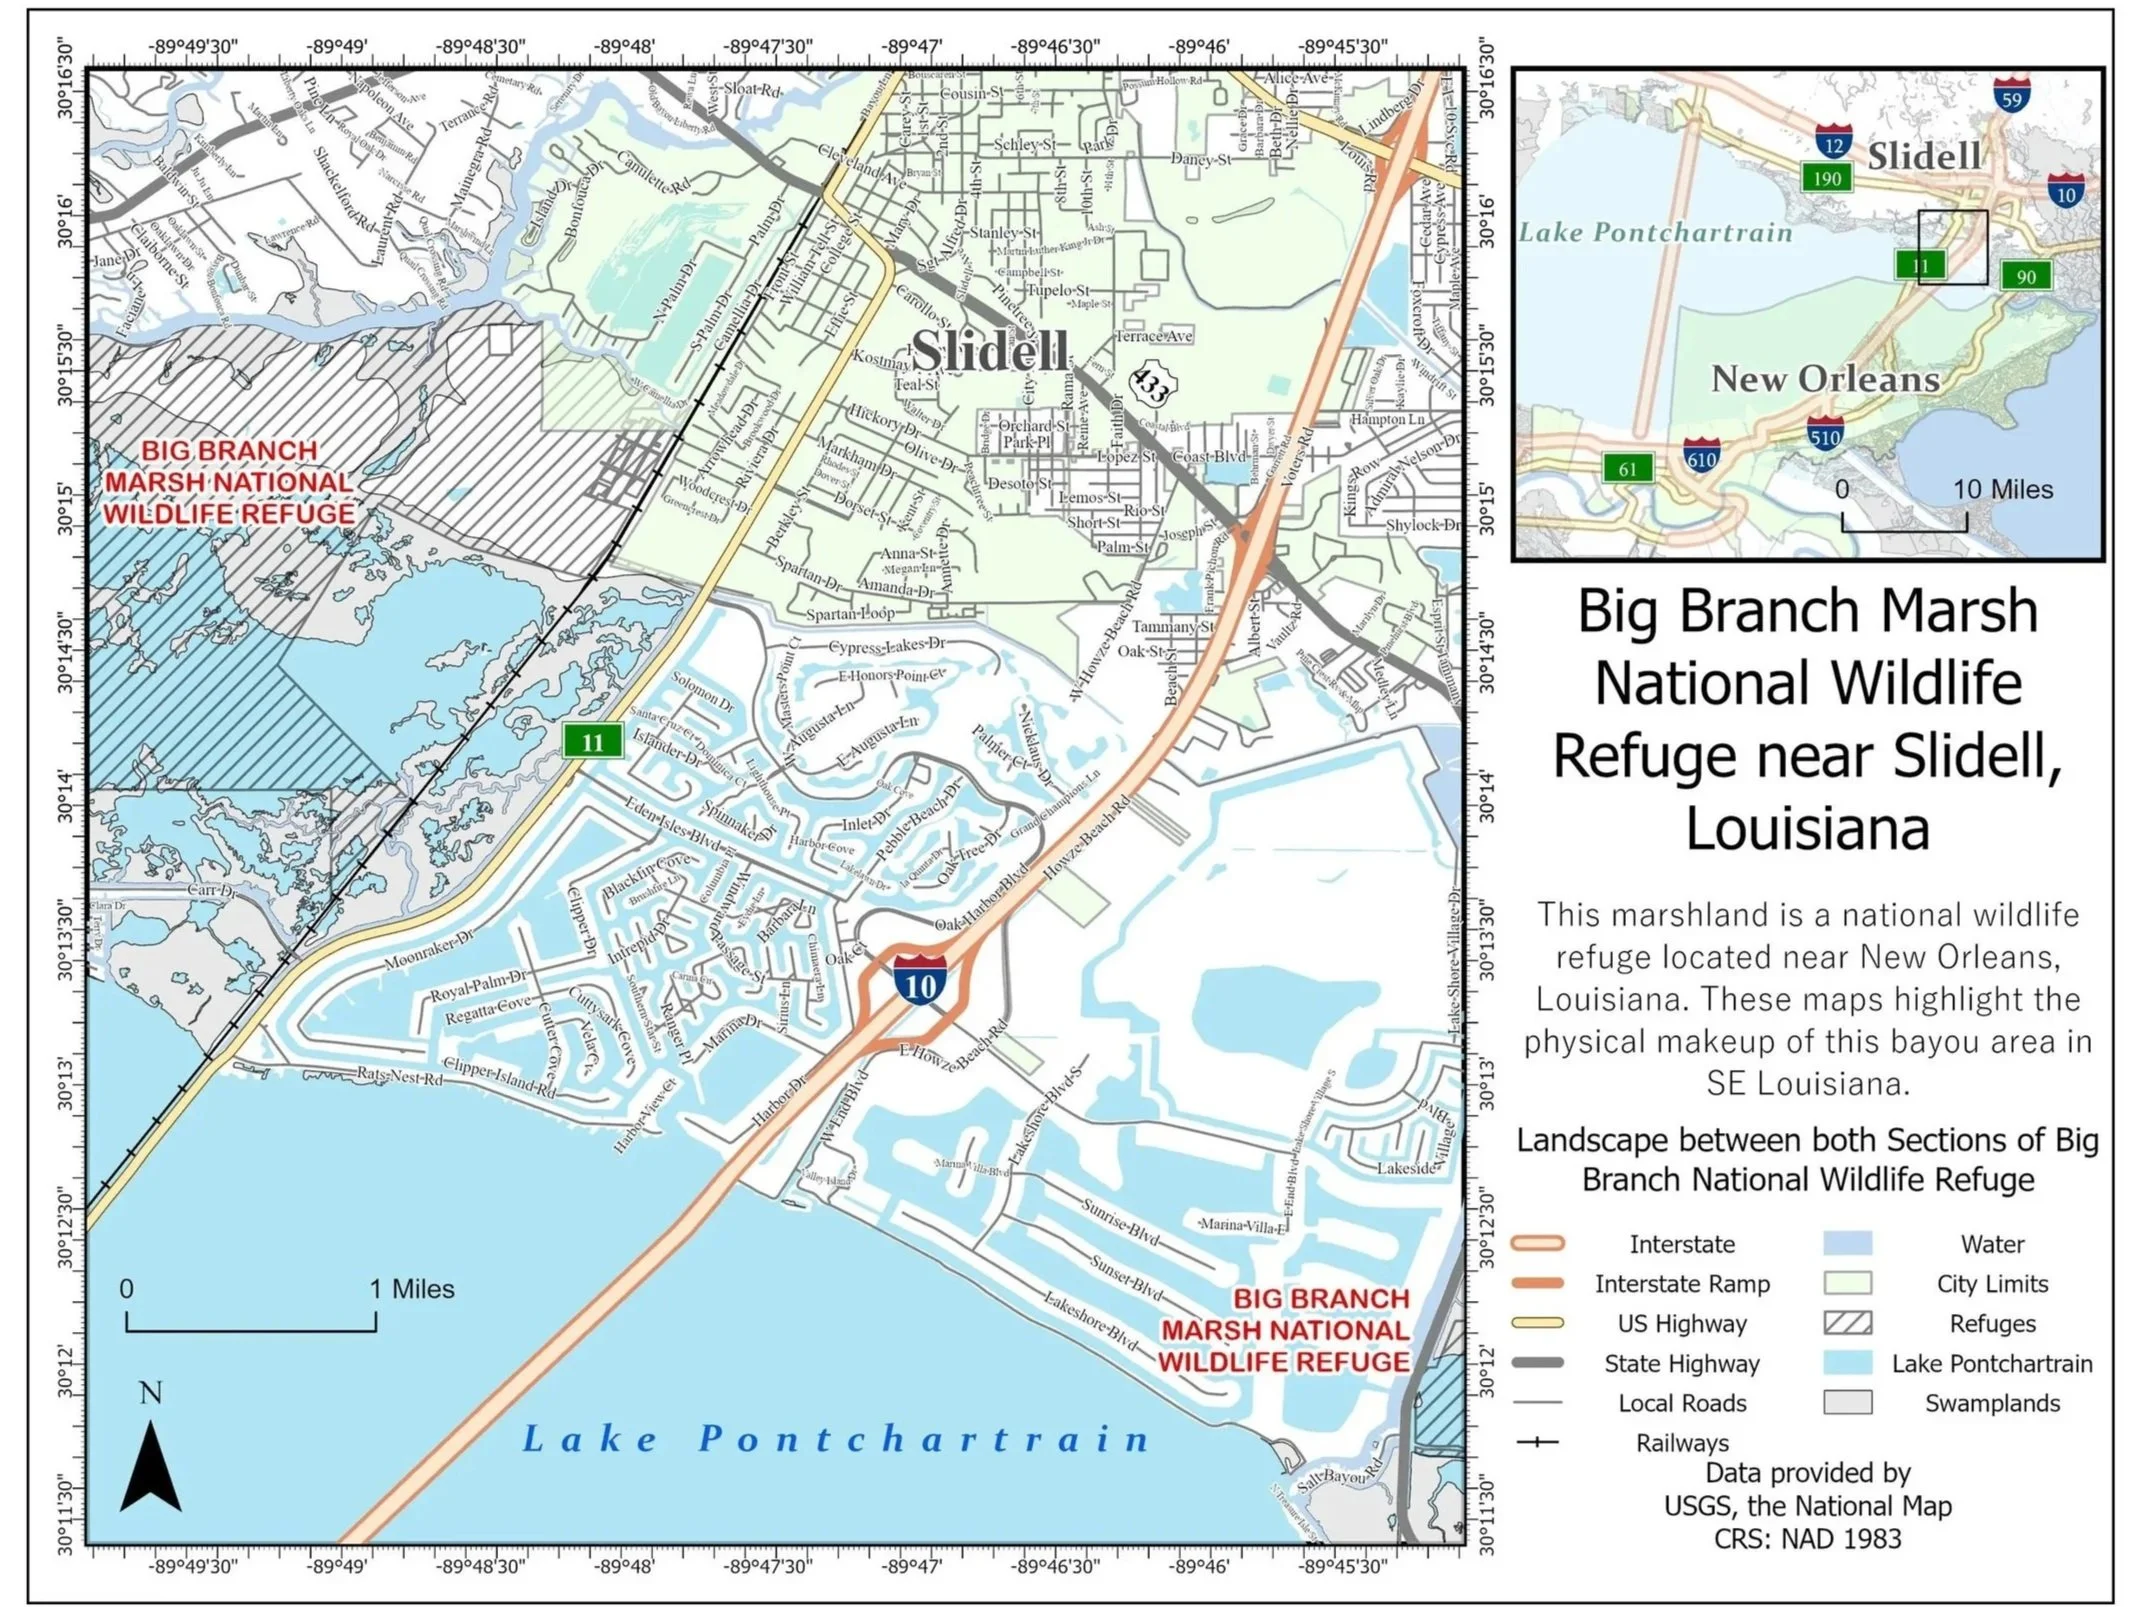
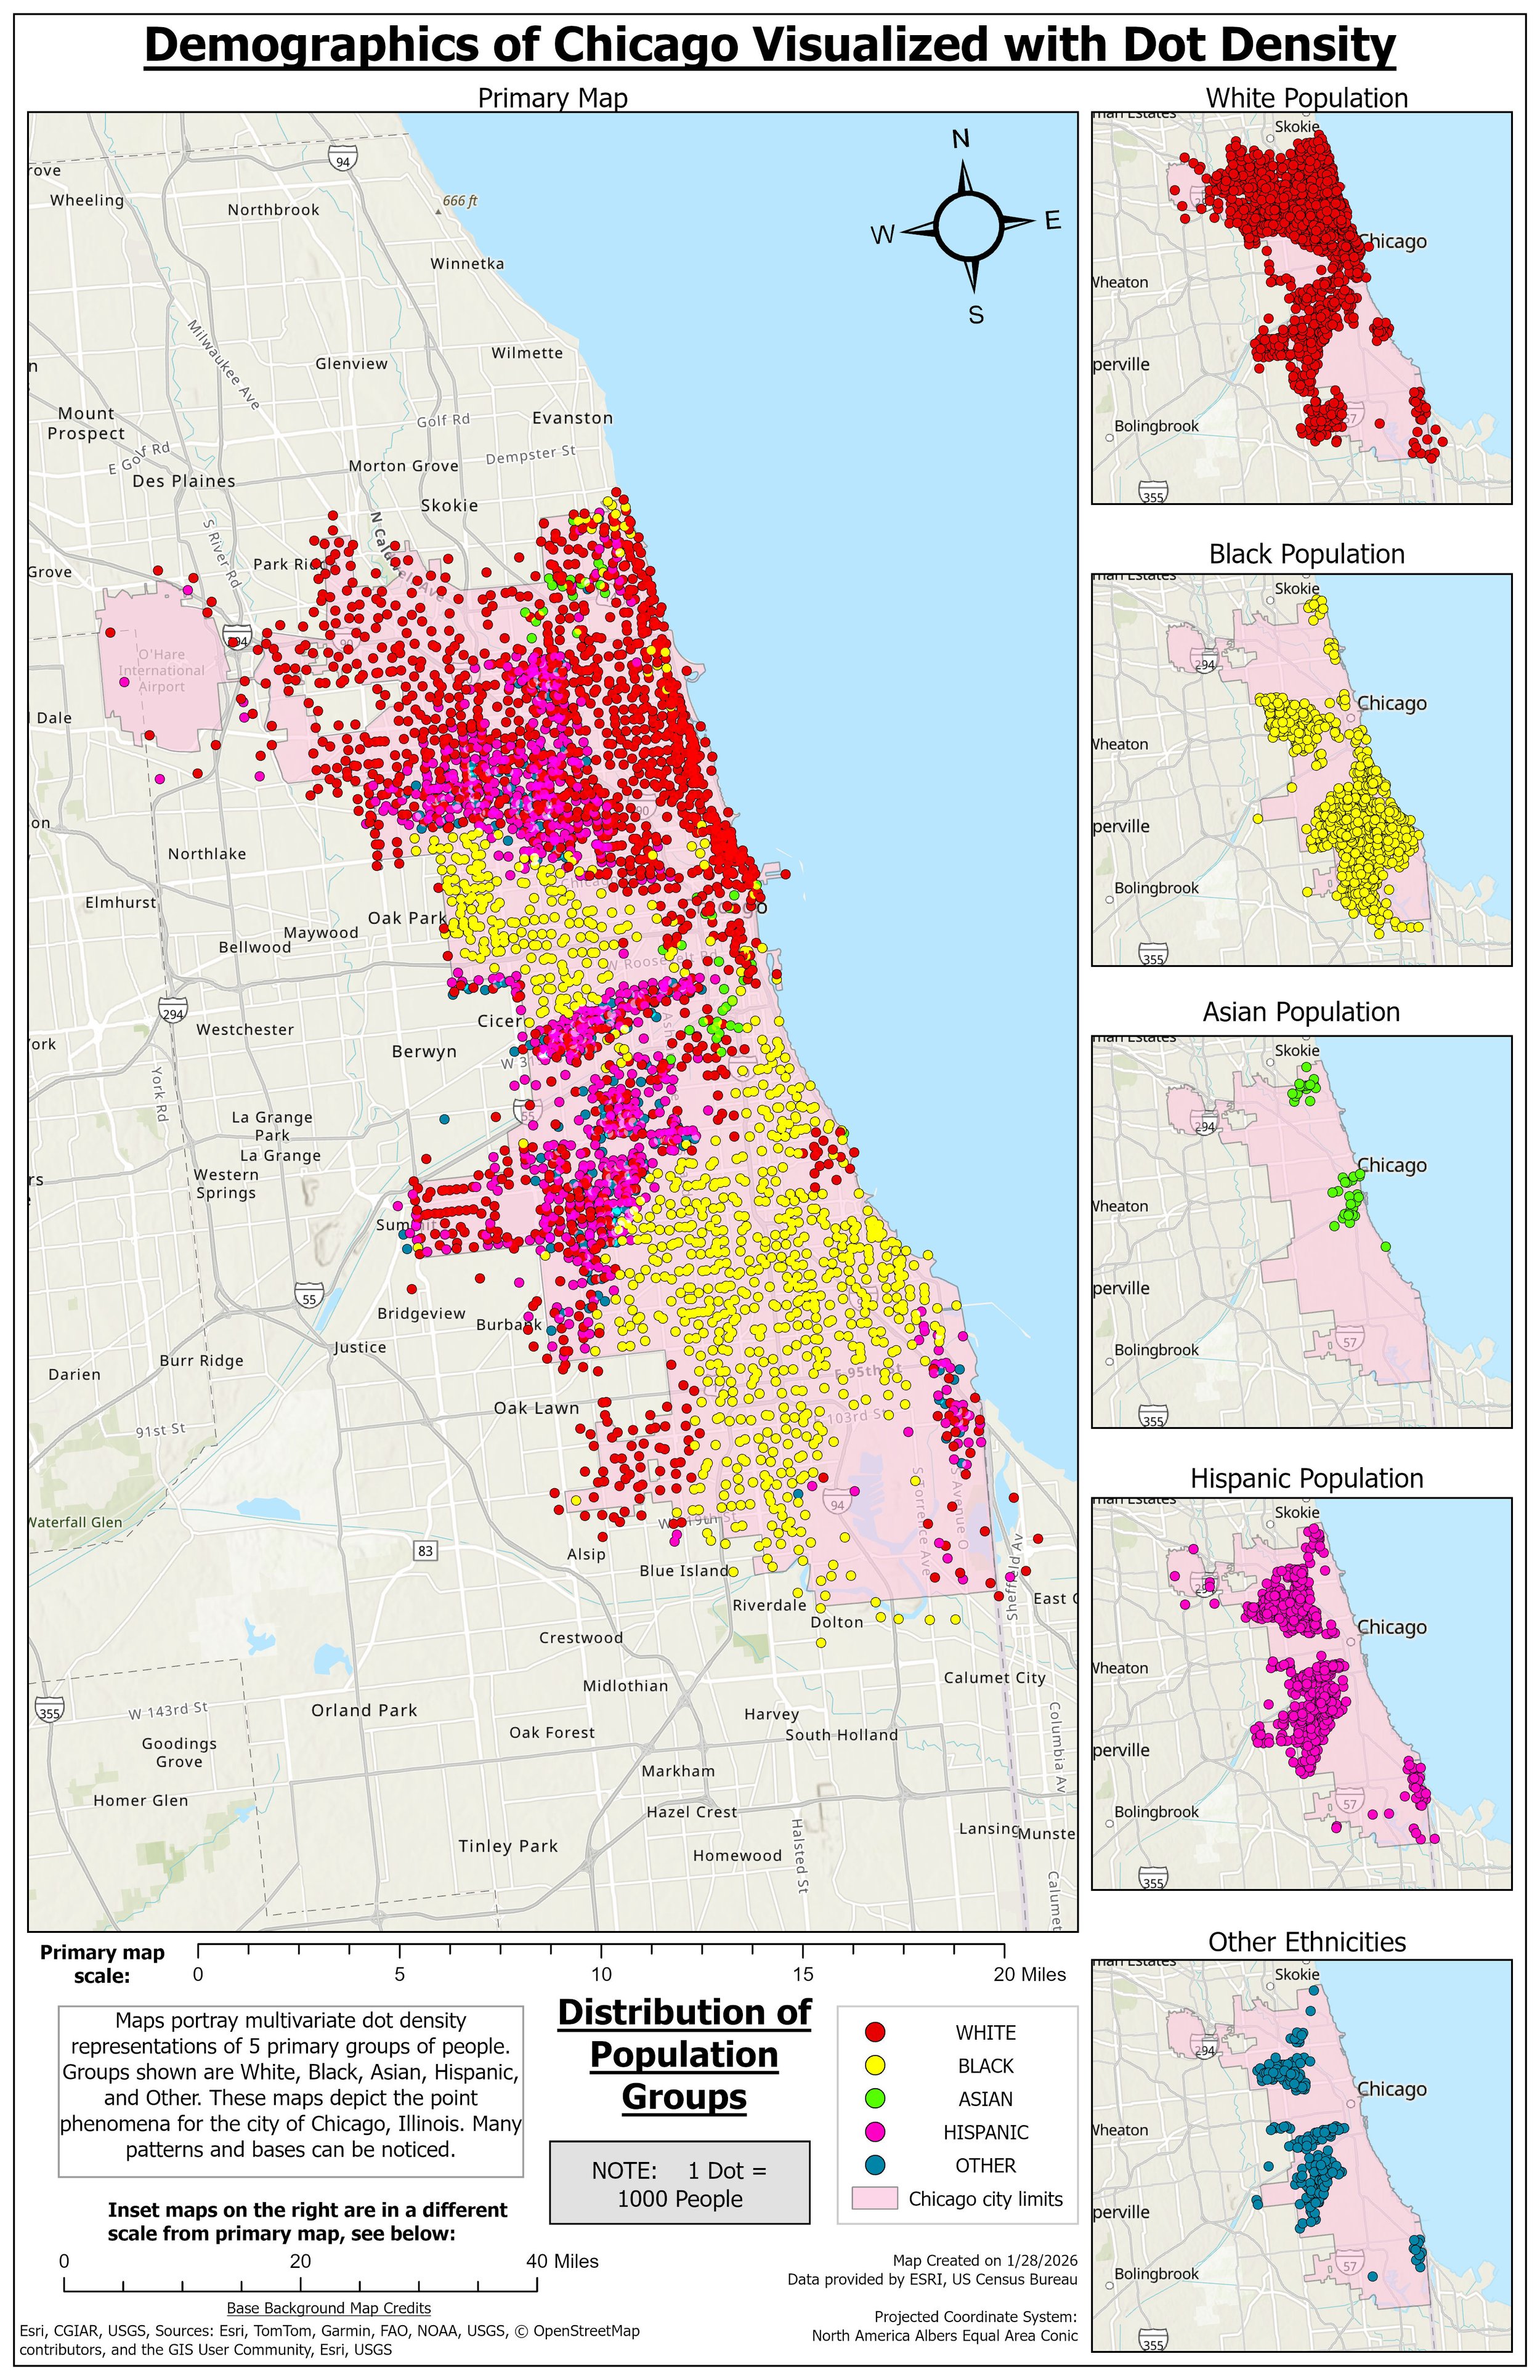
At Pinnacle Perspectives, our passion for cartography is rooted in serving each client’s specific needs. We approach every map with careful attention to accuracy, clarity, and purpose, ensuring the final product communicates exactly what the client needs to see and understand. By tailoring our cartographic design to each project, we deliver maps that are not only visually refined, but practical tools that support informed decisions.
A tailored collection of downloadable map products designed to meet your specific project needs. These may include high-resolution maps, GIS data layers, annotated visuals, and analysis-ready files that you can use for planning, reporting, or presentations.
A professionally designed, high-quality physical map customized to your specifications. This service includes printing and delivery by mail or shipment, ideal for field use, displays, reports, or permanent reference.
A comprehensive service that combines custom digital map products with expert geographic consulting and drone-based analysis. This includes aerial data collection, spatial interpretation, and actionable insights to support decision-making, site assessment, or project development.
OUR MAPPING MISSION:
Aerial mapping and spatial data capture
Designed to support site understanding, documentation, and planning
Accurate ortho-mosaics and mapped imagery
Generated from drone data when spatial reference is required
Basic spatial analysis and measurements
Including distance, area, and site feature identification
Custom map creation
Tailored to clearly communicate location, layout, and spatial relationships
GIS-informed workflows
Ensuring mapped outputs are consistent, reliable, and ready for client use